Any beginner to forex trading will need to understand forex charts. It is simply unavoidable. This beginner’s guide to forex charts will provide individuals with an overview of different types of forex charts and how to understand topics like trendlines, indicators, oscillators, and more.
Technical analysis is not too technical
Analyzing forex charts is a form of technical analysis. But this isn’t something to worry about with a platform. Beginners don’t need to have a STEM degree or be a techie to learn how to read forex charts and devise a trading approach based on analysis. Accessing and monitoring forex charts is simple for beginners and experts alike, allowing anyone to conduct technical analysis.
The main advantage of technical analysis is that traders can make quantitative decisions on what forex pairs to trade. Relying too heavily on news reports and fundamental analysis can easily allow traders to let emotions get in the way of sound trading habits. So, traders should always make sure technical analysis provides a strong foundation for their trading strategy.
Types of forex charts
Different types of forex charts display price data in various visually appealing ways. Line charts are the simplest forex chart. In this type of chart, a line connects the closing price for each day displayed on the chart.
Bar charts include more information than line charts. In addition to the closing price, bar charts often include the opening price and both the high and low of each given day.
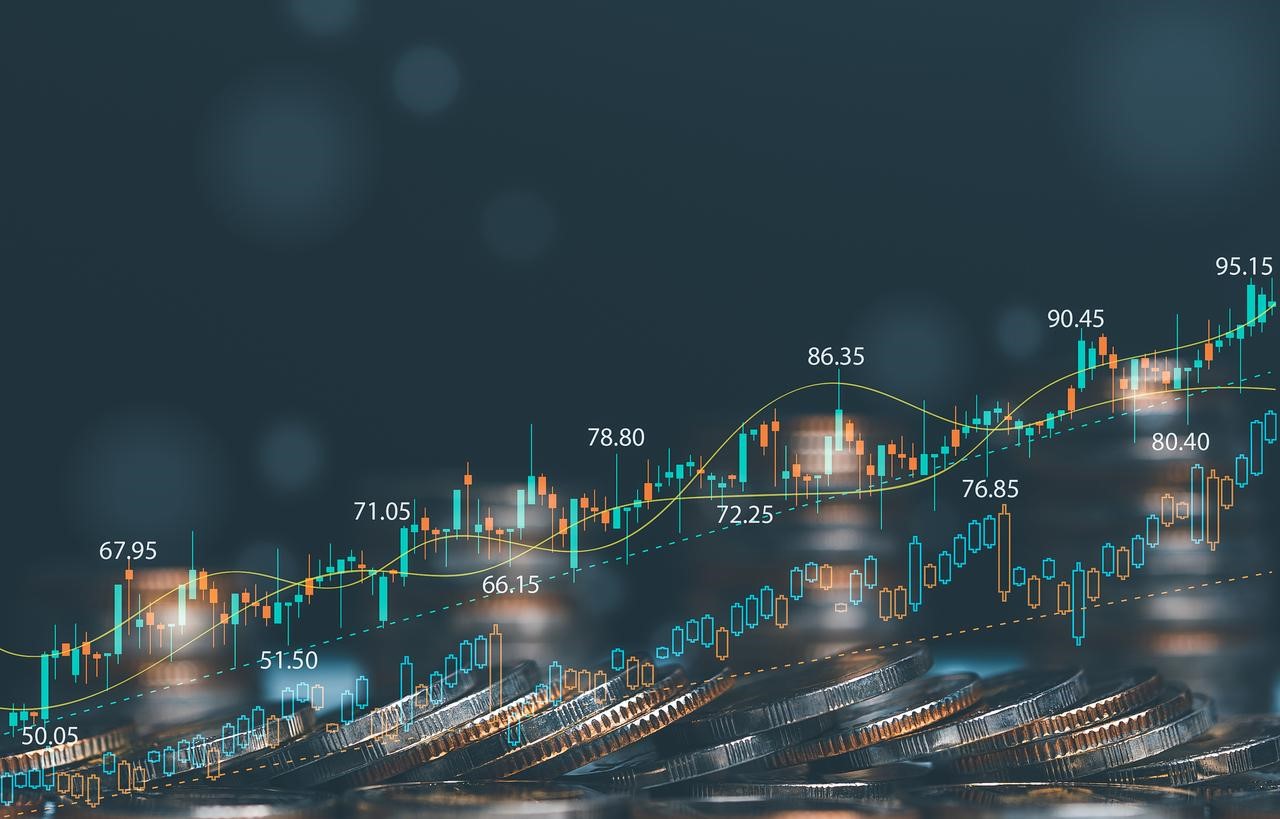
Furthermore, candlestick charts provide a level of detail similar to bar charts. The candlesticks are colored in if the price closed lower on the day, and hollow candlesticks indicate that the price closed higher than the day’s opening. This makes it very easy to see price direction at a glance.
The importance of timeframes
For a forex trader, the timeframes they should pay attention to are largely dependent on what their objectives are. A day trader will need to pay attention to shorter time frames like one-minute and five-minute charts. Those trying to capture a price trend over a longer period can look at three-month, six-month, or even one-year charts.
Trendlines, indicators, and oscillators
Trendlines connect at least two price points on a forex chart that the trader identifies as significant. This helps the trader identify the direction of a trend and support or resistance levels.
Oscillators represent one category of indicators that forex traders use in their analyses. Three popular oscillators are the Relative Strength Index (RSI), Stochastic Oscillator, and the Moving Average Convergence Divergence (MACD).
The RSI, a go-to for many forex traders, measures how strong the price of a currency pair is and indicates whether a currency is overbought or oversold. If the RSI is over 70, the currency might be overbought. An oversold condition is represented by a drop below 30.
The Stochastic Oscillator focuses on a given timeframe and measures how the closing price of a currency pair compares to its price range. The MACD is a useful technical indicator to assess the strength of trends.
Ultimately, no one technical indicator alone is sufficient. Traders should have multiple tools to achieve a comprehensive view of market conditions at any given time.


Add Comment