Best Statista Alternative will be described in this article. Finding statistics to reference in your work can be a long process—one filled with digging through reports and tracking down original sources. Statista is a searchable market and consumer data statistics portal that helps to make this process easier. Statista users can search more than 1 million statistics on 80k topics, including:
- Advertising and marketing
- Agriculture
- Chemicals and resources
- Construction
- Consumer goods
- E-commerce
- Economy and politics
- Energy and environment
- Finance and insurance
- Health
- Internet
- Lifestyle
- Media
- Metals and electronics
- Real estate
- Retail and trade
- Society
- Sports and recreation
- Technology and communication
- Transportation and logistics
- Travel, tourism, and hospitality
Each data point in Statista’s library points back to one of over 22,000 sources and often includes downloadable charts and graphs that users can include in presentations and articles. You can use the platform for:
- Market research
- Business research
- Journalism
- Presentations
- Education
While some of the platform’s basic statistics are available to view for free, much of it lies behind a paywall. If you want to access the entire Statista database—including sources and graphics—you’ll have to subscribe to a paid plan, starting at $59 per month. This subscription gets you access to all of Statista’s historical data, so if you’re interested in hard stats to back up your work, it’s a good option.
But what if you want to get more insights about industry or market trends and future projections? To access that information, you’ll need to either upgrade to a $490 per month Statista plan or pay for a single industry trend report (the cost of which can range into the hundreds of dollars). Whether you’re interested in easier, more affordable access to that forward-looking trend data—or don’t love Statista’s interface—one of these six Statista competitors may be a better intelligence solution for your needs.
1. Our World In Data
Our World in Data is a collaborative research project between the University of Oxford and the Global Change Data Lab. Its datasets are heavily focused on global socioeconomic issues and crises, including topics pertaining to:
- Health
- Food and agriculture
- Energy and environment
- Innovation and technological change
- Poverty and economic development
- Living conditions, community, and wellbeing
- Human rights and democracy
- Violence and war
- Education and knowledge
Our World in Data is typically used by journalists, researchers, students, academics, and anyone interested in its covered topics. Each topic covered by Our World in Data includes:
- A summary
- Interactive charts
- Answers to common questions
- A complete list of sources
The platform contains a vast array of data visualizations for every research need—their report on economic growth contains over 56 interactive charts and maps alone. If your work is focused on major social and economic issues, Our World in Data is a great resource to add to your toolbox. However, if you’re in need of data about trends in technology, business, investment trends, or commerce, you’ll need to look elsewhere.
How Much Does it Cost to Use Our World in Data?
Our World in Data is free to use; there’s no cost to access any report or chart. The group uses a Creative Commons license, and users may cite statistics and charts by giving credit to Our World in Data as the original source.
2. Exploding Topics
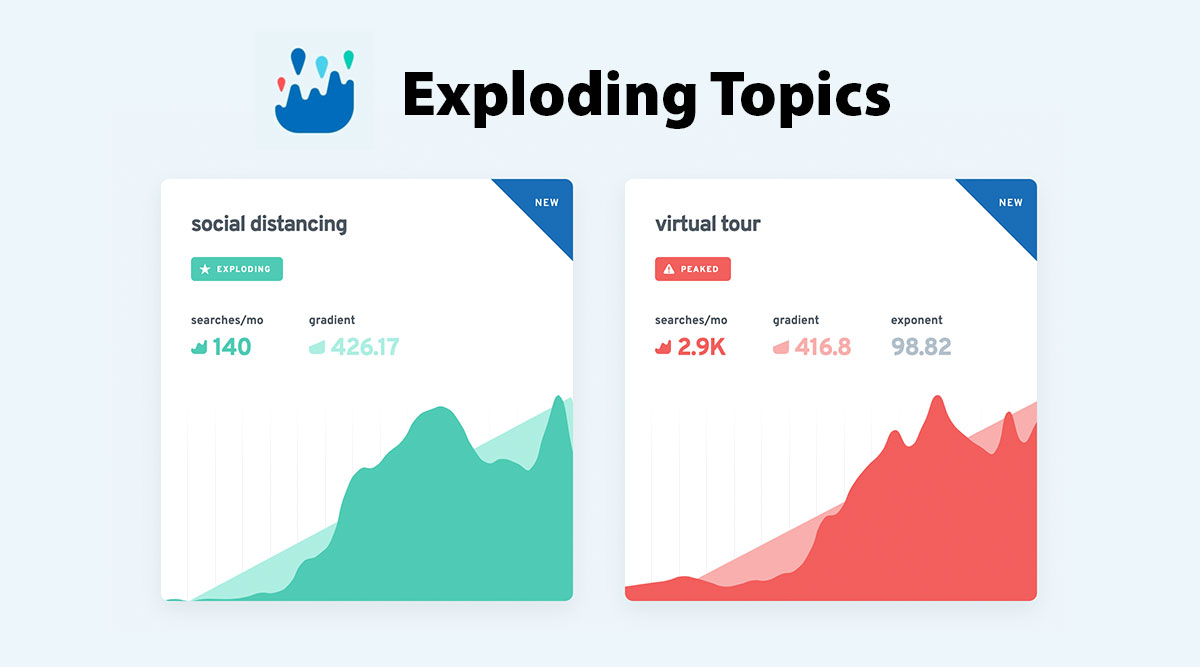
Exploding Topics is a trend research and discovery tool that provides data for a variety of industries, including:
- Crypto and finance
- Media and marketing
- Lifestyle and social
- Luxury and fashion
- Startups and technology
- Health and home
- Eco and travel
- Gaming and software
- Food and fitness
The platform sources its data with the help of artificial intelligence (AI) that looks at online conversations. This data is then reviewed by experienced, human data analysts who identify a topic’s potential to increase in popularity and become a trend in the future. Exploding Topics includes a database you can search by topic, company, industry, or keyword, as well as expert reports on emerging trends and markets. The data is updated daily, so Exploding Topics is an ideal option for anyone who requires to monitor changes in trend popularity in near real-time. It can be used for:
- Finding information and charts to support a report or article that you’re preparing
- Making marketing decisions
- Brainstorming new content and product ideas
- Looking for potential investment opportunities
- Launching new and innovative initiatives
How Much Does it Cost to Use Exploding Topics?
There’s no cost to begin searching the Exploding Topics database, and many of the platform’s graphs are available for everyone to view. To get complete, early access to every Exploding Topics data point, though, you’ll need an Exploding Topics Pro subscription. This starts at just $39 per year (billed annually) and includes:
- Access to new trend data up to a year before anyone else
- Project tracking and organization tools
- Keyword-based trend search
- Lists of trending startups and products
- Instant trend alerts
- A reports library
- API access
- Meta trends analysis
- CSV file export
3. Pew Research Center

The Pew Research Center is a nonpartisan organization that provides reports and statistics based on:
- Global public opinion polling
- Demographic research
- Content analysis
- Social-science research
Pew’s research data covers more than 150 topics. These include:
- Politics and policy
- International affairs
- Immigration and migration
- Race and ethnicity
- Religion
- Generations and age
- Gender and LGBTQ
- Family and relationships
- Economy and work
- Regions and countries
- Science
- Internet and technology
- News habits and media
The Pew Research Center presents many of its statistics and trends in article form—typically accompanied visualizations like infographics and bar charts. If you’re interested in drawing your own conclusions from data about social, political, and economic factors, then the Pew Research Center website could be a good choice. It can also be a good supplement to other news outlets for anyone doing research for reports or articles. However, if you’re looking for more business-focused data or need to explore trend forecasts for your business, Pew may not include the type of data sets you need. You’ll probably be better served by another one of Statista’s top competitors. Also check Contract Management Tools
How Much Does it Cost to Use Pew Research Center?
It is free to browse the Pew Research Center’s reports and download the larger datasets used to create their charts, graphs, and analysis. However, to get the most out of Pew’s datasets, you’ll need to be familiar with statistical software, .sav files, and ASCII text files.
4. IBISWorld

The IBISWorld database contains market data for use by businesses and academic institutions. While it can be used by anyone, much of its data is focused on the U.S., U.K., Australia, and Europe.
You can use IBISWorld to view market outlook reports and statistics for 30 sectors, including:
- Administration and business support services
- Agriculture, forestry, fishing, and hunting
- Arts, entertainment, and recreation
- Finance and insurance
- Healthcare and social assistance
- Manufacturing
- Public administration and safety
- Retail trade
- Utilities
- Wholesale trade
The company says you can use its platform for purposes such as:
- Academics
- Business valuations
- Commercial banking
- Consulting
- Legal work
- Marketing work
- Sales
If your research covers one of these areas, you may find IBISWorld useful. However, some potential users may find budget to be a concern. Also check Media Modifier Alternatives
How Much Does it Cost to Use IBISWorld?
You can access some IBISWorld data for free. When you search the database and click on a topic, you’re presented with:
- An overview of relevant market trends
- A summary of IBISWorld’s outlook for the market
- Select statistics, such as total market size
- Top companies in a relevant sector
To see all information, you’ll need to purchase a membership or a single report. These reports include expanded data including:
- Top companies’ market share
- Industry trends
- Industry operating conditions
- Profitability analysis
- Market revenue forecasts
- Growth forecasts
Single reports cost $995; an IBISWorld membership costs $1,295 and lasts for three months.
5. Gallup

Gallup is an analytics firm and polling organization. The organization’s data is often cited in news articles about political and economic topics, but Gallup collects data on a number of other topics as well. These include:
- Employee engagement and wellbeing
- Environmental, social, and governance
- Hybrid work
- Leadership and management
- Life Evaluation Index (a measure of how people rate their current lives and future expectations)
- S. Satisfaction (how Americans feel about their current government)
You can glean insights from Gallup data by browsing their official reports on any of the above topics or by reading articles in the Gallup Short Answer news center. Through the news center, you can see statistics on additional topics, such as:
- Crime
- Religion
- Firearms
- Global warming
- UFOs
- Health
- Investing
- Business
A lot of Gallup’s data is focused on U.S. audiences, so if you’re looking for more global insights—or data about other industries—you’ll probably want to try another Statista alternative.
How Much Does it Cost to Use Gallup?
There’s no charge to browse the Gallup site and view available reports and data sets. The company generates revenue by charging for assessment and survey tools often used by corporations.
6. Google Dataset Search
Google’s Dataset Search is a search engine for data. While regular Google search results can include reports and statistics, Dataset Search only returns those kinds of results. Google’s data search feature draws from 25 million indexed datasets, and can be used by:
- Students
- Researchers
- Journalists
- Businesses
- Data scientists
- Casual searchers
You can search for any topic when using Google’s tool, and suggested searches begin to populate as soon as you start typing—just like when conducting a normal web search. Search results include an overview of the relevant dataset, its publication date, and the author, along with links to the source as found elsewhere online.
How Much Does it Cost to Use Google Dataset Search?
Google Dataset Search is free to use, but many of the datasets found through Google’s search trace back to Statista. That means that your ability to see the full dataset may be limited if it involves a chart or report that Statista has placed behind a paywall.
Get The Data You Need For Your Work Now—And In The Future
If you need to browse data about singular events that have occurred in the past, or want to read the results of a large-scale formal survey, then services like Statista and Gallup are certainly useful options.However, if you’d like to know what people are talking about and interested in as they use social media and search the web, Exploding Topics might be worth trying.
When you use our platform to explore trending topics, you get access to expert-reviewed trend data that refreshes on a daily basis. And unlike some Statista alternatives, you won’t need any special statistical software. Every Exploding Topics data point is presented as clean graphs and straightforward reports that break down the trends you need to know about today. Start browsing the Exploding Topics database right now for free, or try out a Pro subscription to access every data point and report—it’s just $1 for your first two weeks.


Add Comment